Prometheus 3.0 is Here: Better UI, Faster Metrics, and (Still) Fewer Calories

Hey folks, Alex Sharabudinov here — your friendly neighborhood Stackbooster CEO and resident Kubernetes whisperer. Prometheus 3.0 has officially landed, and it’s more exciting than a Friday night Kubernetes rollout (just kidding, nothing beats that thrill).
What's new in Prometheus 3.0 (apart from the fancy version number)?
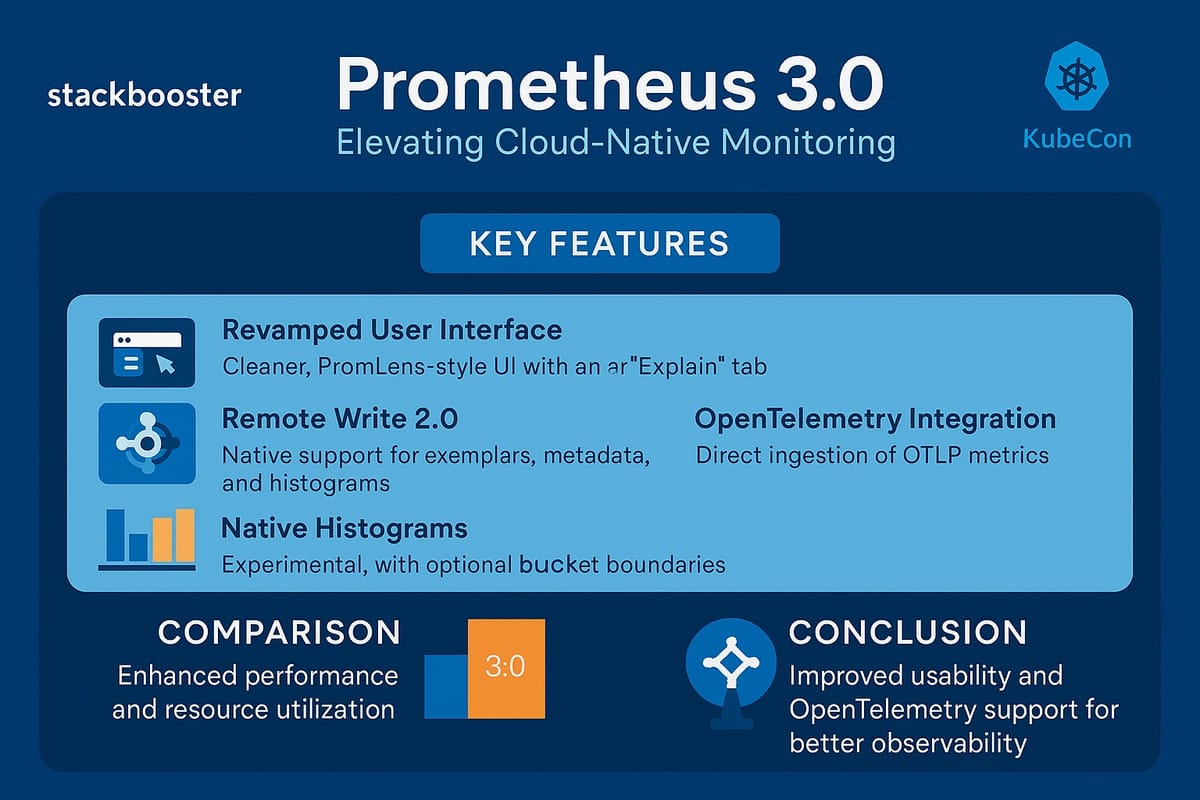
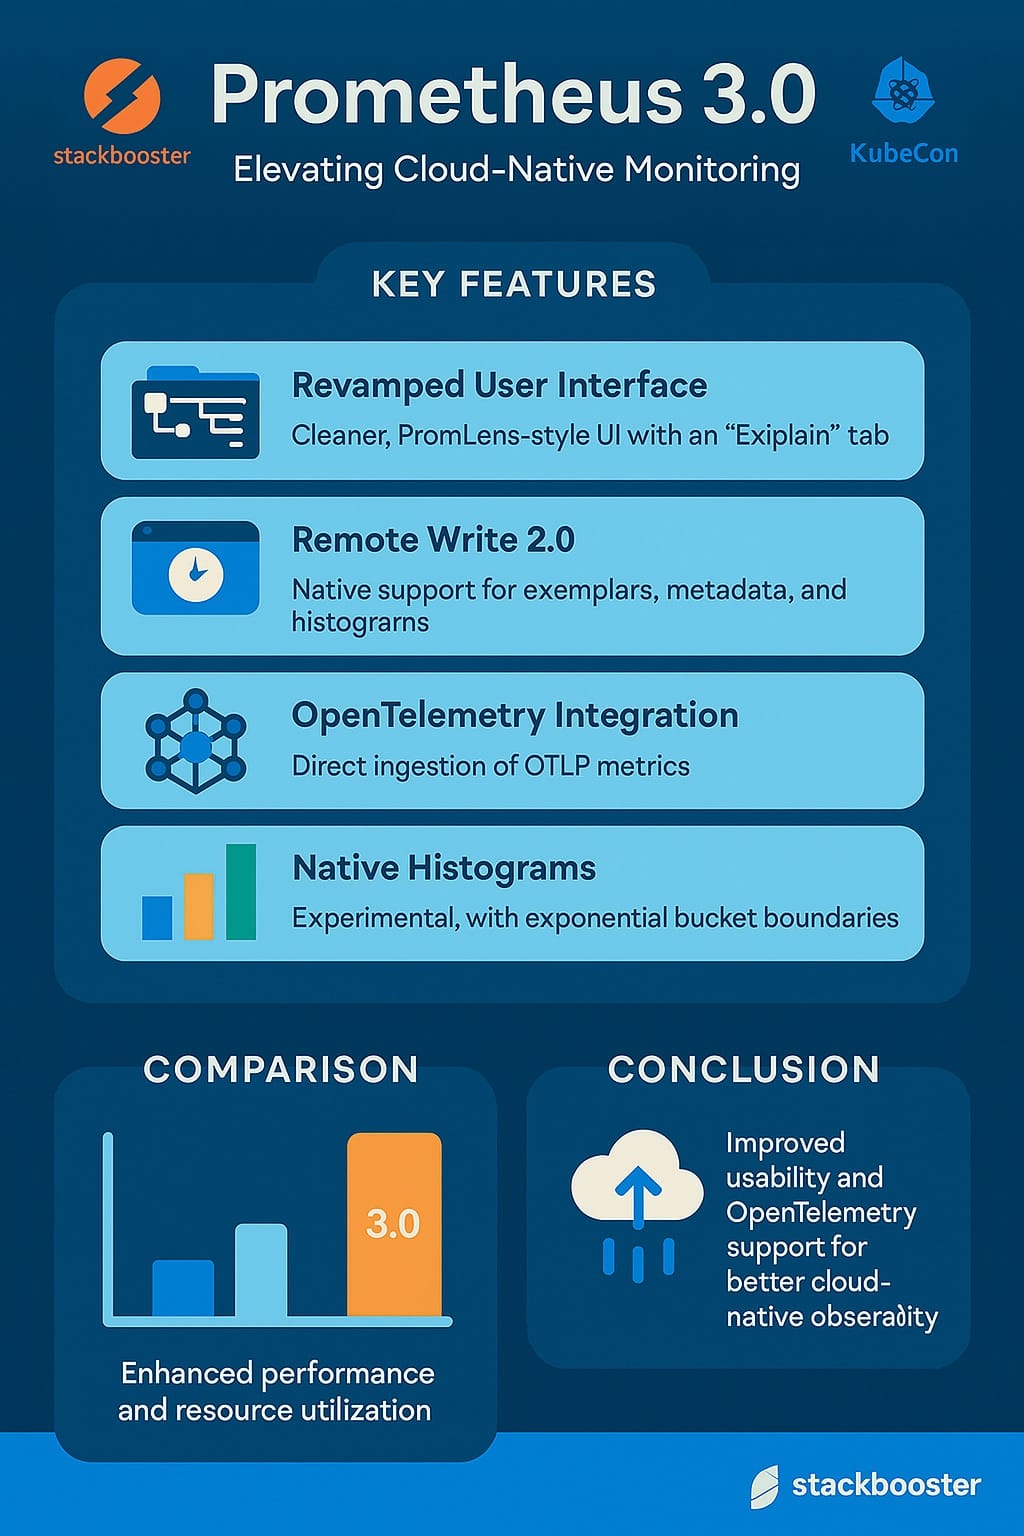
1. Sleek New UI—Finally, Prometheus went shopping
Prometheus has just had a facelift smoother than Ryan Reynolds' jokes (nearly). The redesigned interface includes:
- A tree view in the PromLens style allows for straightforward visualisation of queries.Think of it as Prometheus’ own GPS for navigating metrics—minus the British accent.
- Enhanced metrics explorer for easier, faster metric queries.
- An “Explain” tab that makes PromQL queries clear enough that even marketing can understand. (Well, almost.)
2. Remote Write 2.0—Like Regular Remote Write, but on Espresso
Prometheus has optimized Remote Write with metadata support, exemplars, and reduced CPU usage—because servers deserve coffee breaks too. And it’s efficient enough to make VictoriaMetrics slightly less smug (looking at you, Victor).
3. OpenTelemetry Integration: We're All Friends Here
Prometheus now natively accepts OTLP metrics, bridging the gap between Prometheus and OpenTelemetry like a well-written Hollywood bromance. (Did someone mention Hugh Jackman and Ryan Reynolds?)
4. Full UTF-8 support—because emojis in metric names were long overdue.
Your labels can now proudly include UTF-8 characters. Yes, even the shrug emoji ¯\(ツ)/¯. Why not?
5. Native Histograms—Buckets, but Make Them Smart
Native histograms are here, auto-tuning bucket boundaries better than Spotify playlists. You can enable it with a simple flag. Easy, right?
Prometheus vs. VictoriaMetrics — The Eternal Rivalry
VictoriaMetrics, that lean, mean resource-efficient machine, still might have Prometheus beat on raw efficiency. If Prometheus 3.0 is a luxury SUV, VictoriaMetrics is an electric scooter that zips through traffic.
But Prometheus responds with:
- Strong OpenTelemetry support - Industry-leading PromQL capabilities.
- A functioning ecology (because size does important).
Where Prometheus Still Needs Some TLC.
Even with these enhancements, Prometheus still has a few mountains to climb:
- Scalability: At large size, Prometheus can become resource-hungry, much like me at an all-you-can-eat cloud-native buffet.
- High Availability: Still requires other solutions such as Thanos or Cortex. It works well, however it would be wonderful if clustering was built in. It's like having Netflix bundled with your cable subscription—unlikely, but a boy can dream.
Actionable Tips From Your Friendly CEO
- Scale your testing by benchmarking your environment. VictoriaMetrics might be leaner, but Prometheus packs more punch.
- Feature Awareness: If you need specific UI features (like heatmap histograms), be aware they’re coming soon. Patience is a virtue—or so I’m told.
- Plan for HA: If uptime is your lifeline, integrating Thanos or Cortex is still your best bet.

Wrapping Up (Like Deadpool, but with fewer weapons).
Prometheus 3.0 includes significant enhancements that increase user experience and efficiency. It's clever, slick, and entertaining, just like a good Reynolds film—but there's still opportunity for a sequel.
Stay tuned, keep an eye on things, and remember that Kubernetes isn't so scary when you have the correct Prometheus version (and a CEO with amazing technological taste).
Cheers,
Alexander Sharabudinov.
Stackbooster CEO, Kubernetes enthusiast, and the occasional Ryan Reynolds impersonator.


