How to measure real usage and find where your Kubernetes resources are leaking

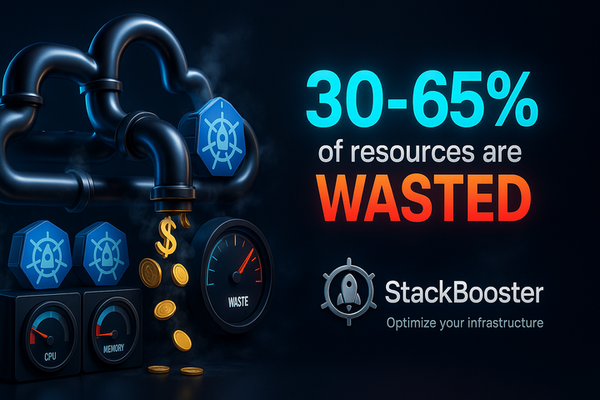
Kubernetes has transformed how organizations scale and manage modern infrastructure. Yet, even the most mature teams face a common problem: resource inefficiency. Beneath the surface of automation and elasticity, clusters quietly leak resources: wasting compute, memory, and budget every minute they run.
But here’s the real challenge: most teams don’t actually know where that waste is happening. If you can’t measure real usage, you can’t optimize it, and that’s where visibility, data, and automation meet.
Resource waste in Kubernetes
In theory, Kubernetes should make workloads elastic and cost-efficient. In practice, though, even mature DevOps teams struggle with resource leakage caused by overprovisioning, idle nodes, and manual scaling loops.
Common culprits include:
- Static limits and requests: Developers allocate CPU and memory far above actual usage “just to be safe.” We’ve all done it — because no one wants production incidents.
- Idle or oversized nodes: Clusters stay overpowered even during off-peak hours.
- Lack of observability: Teams track by namespace or workload, not by true performance behavior.
- Reactive scaling: Adjustments happen after spikes, never before.
These issues quietly accumulate — until the cloud bill makes them impossible to ignore.
Why manual optimization falls short
Dashboards and tuning scripts can show you what happened, but not what to do next.
Here’s the cycle most teams are stuck in:
- You review metrics and tweak requests.
- Traffic patterns shift.
- Autoscalers react too late or too conservatively.
- Off-peak hours leave half your nodes idling.
- And you start all over again.
It’s a constant loop of firefighting — not optimization.
That’s why visibility alone isn’t enough. You need intelligence that can interpret, predict, and act.
Step 1: Measure real usage — not allocations
Right-sizing is essential, but it’s not the whole story.
You can optimize workloads today and still waste tomorrow — because configurations drift, traffic changes, and deployments evolve.
To measure true efficiency, combine:
- Pod-level usage metrics (CPU/memory over time).
- Cluster-wide utilization averages (to detect chronic underuse).
- Workload right-sizing analysis (compare what’s used vs. what’s given).
- Historical trends (7–30 days to spot recurring patterns).
Tools like Prometheus, Grafana, and Cloud Monitoring help you see data — but they don’t decide or act. That’s where intelligence must take over.
Step 2: Identify the leakage points
Once you have visibility, the next step is pinpointing where waste hides.
Typical “leak zones” include:
- Safety margins that never shrink — requests set high “just in case.”
- Off-peak idling — nights, weekends, and seasonality leave capacity stranded.
- Zombie workloads — forgotten jobs or replicas still consuming resources.
- Underutilized nodes — poor bin-packing or affinity rules leave nodes half-empty.
Static right-sizing can plug some holes, but the leaks reopen as soon as usage changes.
That’s why continuous, AI-driven correlation and context are key to lasting optimization.
Step 3: From data to action — automate optimization
Manual optimization is tedious and never-ending. You analyze dashboards, tune requests, update YAMLs — and workloads shift again.
Instead, modern teams use intelligent automation to:
- Continuously analyze usage and cost trends.
- Right-size workloads automatically — not quarterly.
- Scale nodes and apps proactively, not reactively.
- Detect waste in real time and recommend (or apply) fixes.
This closes the gap between visibility and action — and it’s exactly where StackBooster comes in.
AI-driven optimization: where the real gains happen
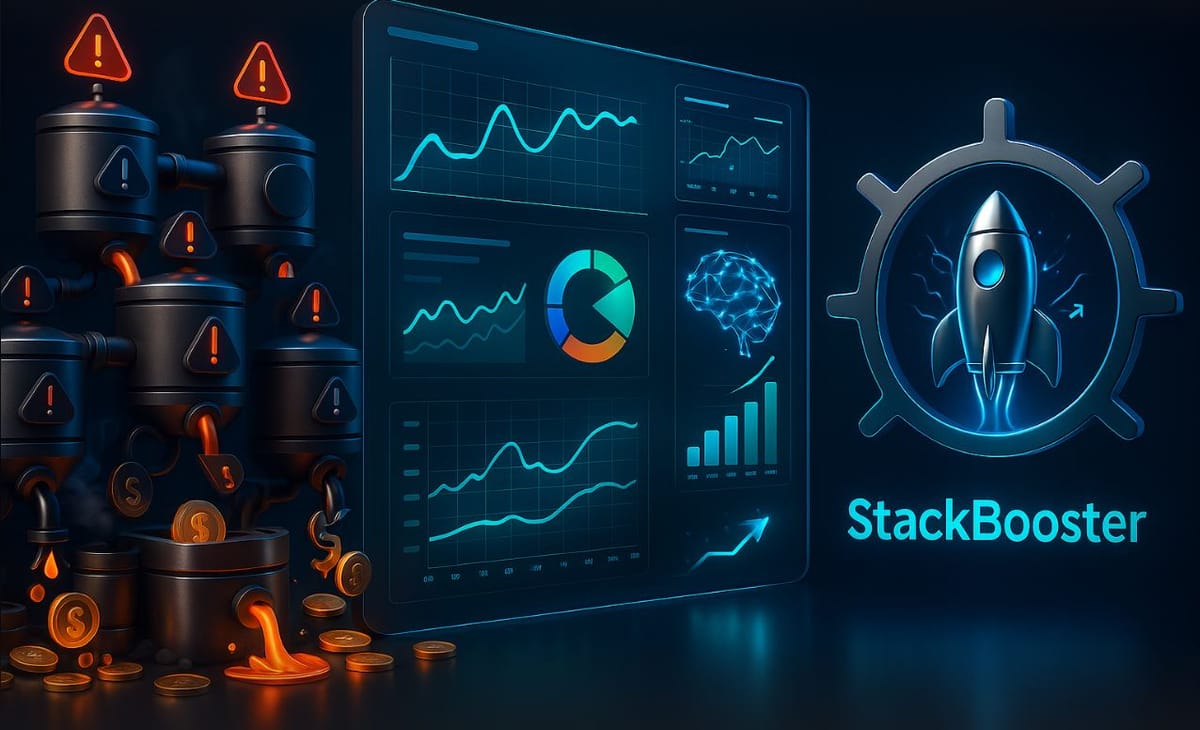
StackBooster acts as an AI agent for Kubernetes, turning complex resource management into continuous, intelligent automation.
It:
- Monitors app and node performance in real time.
- Predicts usage patterns and adjusts allocations dynamically.
- Repacks workloads to maximize node efficiency.
- Cuts cloud costs by up to 80% while maintaining reliability.
The result: a lean, fast, self-optimizing Kubernetes environment — without manual grind, guesswork, or constant retuning.
Static configurations and manual scaling belong to yesterday. Today’s DevOps and Platform Engineering leaders use AI automation not as convenience, but as a competitive advantage.
Start by measuring real usage, identifying leaks, and introducing intelligent automation — because every hour of delay is another few percent of your budget slipping into thin air.
Want to see where your Kubernetes budget is leaking?
👉 Book a free resource audit with the StackBooster team and uncover your hidden waste.